2008年07月23日
課題2 時系列データ の例
課題2 時系列データ
① データ名(期間)
② モデルの推計結果
③ 予測図
基本的のこの3つは押さえておいてください。
以下に例を示します。
例
① データ名:鉱工業生産指数
期間:1978年1月:2007年8月
② SARIMAモデルによる推計結果
Call:
arima(x = xts, order = c(2, 1, 2), seasonal = list(order = c(1, 1, 1), period = 12))
Coefficients:
ar1 ar2 ma1 ma2 sar1 sma1
0.6423 -0.0023 -1.1557 0.531 0.3178 -0.7089
s.e. 0.1286 0.0863 0.1172 0.068 0.0800 0.0528
sigma^2 estimated as 2.846: log likelihood = -668.11, aic = 1350.21
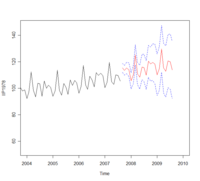
③ 予測図

時系列予測については予測モデルと予測結果の図のみで良いが、余力あれば自習も兼ねてコメントも試みてはどうでしょうか?
参考:コメント
予測期間は2007年9月から24ヶ月間
信頼限界を見る限り、最初の1年間の予測は良好と判断できる。
予測誤差は拡大していくが、それほど大きくはなっていないものと思われる。
トレンドとしては上昇傾向であるが、最近の原油価格上昇の影響による景気減速のため予測値は実績値より、高めとなっている可能性がある。このような不規則衝撃がなければ予測値のまま推移したものと思われる。
予測値と実績値に差が生じた場合、それは景気減速により失われた経済的利益と考えられる。
① データ名(期間)
② モデルの推計結果
③ 予測図
基本的のこの3つは押さえておいてください。
以下に例を示します。
例
① データ名:鉱工業生産指数
期間:1978年1月:2007年8月
② SARIMAモデルによる推計結果
Call:
arima(x = xts, order = c(2, 1, 2), seasonal = list(order = c(1, 1, 1), period = 12))
Coefficients:
ar1 ar2 ma1 ma2 sar1 sma1
0.6423 -0.0023 -1.1557 0.531 0.3178 -0.7089
s.e. 0.1286 0.0863 0.1172 0.068 0.0800 0.0528
sigma^2 estimated as 2.846: log likelihood = -668.11, aic = 1350.21
③ 予測図

時系列予測については予測モデルと予測結果の図のみで良いが、余力あれば自習も兼ねてコメントも試みてはどうでしょうか?
参考:コメント
予測期間は2007年9月から24ヶ月間
信頼限界を見る限り、最初の1年間の予測は良好と判断できる。
予測誤差は拡大していくが、それほど大きくはなっていないものと思われる。
トレンドとしては上昇傾向であるが、最近の原油価格上昇の影響による景気減速のため予測値は実績値より、高めとなっている可能性がある。このような不規則衝撃がなければ予測値のまま推移したものと思われる。
予測値と実績値に差が生じた場合、それは景気減速により失われた経済的利益と考えられる。
Posted by ryu908 at
17:29
│Comments(2)
2008年07月23日
課題1 横断面データ の例
課題1 横断面データ
① 変数リスト
② 変数間の関係
③ 結果
基本的のこの3つは押さえておいてください。
以下に例を示します。
例
① 採用した変数群
id 市町村名
x1 地域差指数総合
x2 地域差指数食料
x3 一人当たり県民所得
x4 県内総生産額対前年増加率
x5 県内総生産対前年増加
x6 財政力指数
x7 携帯電話
x8 パソコン所有数量
x9 第1次産業就業者比率
x10 保育所数
x11 労働災害発生の頻度
② 各変数間の関係は図のとおりである。

x8はきれいな山型の分布だが沖縄が特に低く、全体から離れている。
また、x2、x6、x7と正の相関がみられ、x9とは負の相関はっきりと読みとれる。
③ x8:パソコン所有数量を目的変数とし、市民レベルでの情報化の進展度を調べた。
情報化の要因として上にピックアップした変数全てをインプットしてみた。
結果の出力

n= 47
node), split, n, deviance, yval
* denotes terminal node
1) root 47 878724.40 942.2340
2) x3< 2368.5 10 85688.10 752.3000 *
3) x3>=2368.5 37 334787.10 993.5676
6) x3< 2830 22 99880.95 940.0455
12) x7< 1767.5 7 19166.00 884.0000 *
13) x7>=1767.5 15 48466.40 966.2000 *
7) x3>=2830 15 79452.93 1072.0670 *
結果をみるとx3:「一人当たり県民所得」が2368千円で2つのグループに分かれ、これより低い群は10県でパソコン所有数量が千世帯当たり平均752.3台となっている。因みに沖縄は525台である。
次に「一人当たり県民所得」が2368千円より高い群はさらに2830千円で2群に分かれ、高い群は千世帯当たり平均1072台で15都府県がこのグループに属する。
中間の集団はx7:「携帯電話」千世帯当たり1768台より少ないか多いかで分かれ、少ないほうは7県でパソコン所有数量千世帯当たり平均884台となっている。多いほうは15県でパソコン所有数量千世帯当たり平均966台となっている。
市民レベルでの情報化は一人当たり所得と携帯電話の普及が大きな要因となっており、他の変数の影響は小さいものと思われる。
ただし、その他の要因として上にあげた変数以外も追加するなどして検討する必要はある。
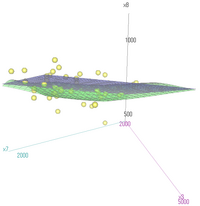
参考までにx8、x3、x7の3次元プロットと回帰平面、回帰曲面の図をあげておく。

① 変数リスト
② 変数間の関係
③ 結果
基本的のこの3つは押さえておいてください。
以下に例を示します。
例
① 採用した変数群
id 市町村名
x1 地域差指数総合
x2 地域差指数食料
x3 一人当たり県民所得
x4 県内総生産額対前年増加率
x5 県内総生産対前年増加
x6 財政力指数
x7 携帯電話
x8 パソコン所有数量
x9 第1次産業就業者比率
x10 保育所数
x11 労働災害発生の頻度
② 各変数間の関係は図のとおりである。

x8はきれいな山型の分布だが沖縄が特に低く、全体から離れている。
また、x2、x6、x7と正の相関がみられ、x9とは負の相関はっきりと読みとれる。
③ x8:パソコン所有数量を目的変数とし、市民レベルでの情報化の進展度を調べた。
情報化の要因として上にピックアップした変数全てをインプットしてみた。
結果の出力

n= 47
node), split, n, deviance, yval
* denotes terminal node
1) root 47 878724.40 942.2340
2) x3< 2368.5 10 85688.10 752.3000 *
3) x3>=2368.5 37 334787.10 993.5676
6) x3< 2830 22 99880.95 940.0455
12) x7< 1767.5 7 19166.00 884.0000 *
13) x7>=1767.5 15 48466.40 966.2000 *
7) x3>=2830 15 79452.93 1072.0670 *
結果をみるとx3:「一人当たり県民所得」が2368千円で2つのグループに分かれ、これより低い群は10県でパソコン所有数量が千世帯当たり平均752.3台となっている。因みに沖縄は525台である。
次に「一人当たり県民所得」が2368千円より高い群はさらに2830千円で2群に分かれ、高い群は千世帯当たり平均1072台で15都府県がこのグループに属する。
中間の集団はx7:「携帯電話」千世帯当たり1768台より少ないか多いかで分かれ、少ないほうは7県でパソコン所有数量千世帯当たり平均884台となっている。多いほうは15県でパソコン所有数量千世帯当たり平均966台となっている。
市民レベルでの情報化は一人当たり所得と携帯電話の普及が大きな要因となっており、他の変数の影響は小さいものと思われる。
ただし、その他の要因として上にあげた変数以外も追加するなどして検討する必要はある。
参考までにx8、x3、x7の3次元プロットと回帰平面、回帰曲面の図をあげておく。

Posted by ryu908 at
17:26
│Comments(2)
2008年07月16日
ARIMAのサンプル
### IIPへの当てはめ
x<-read.table("clipboard",header=T)
ty1<-ts(x,start=c(1978,1),freq=12)
plot(ty1)
plot(decompose(ty1))
spectrum(ty1)
spectrum(ty1,method="ar")
par(mfrow=c(2,1))
acf(ty1,lag.max=100)
pacf(ty1,lag.max=100)
par(mfrow=c(1,1))
##### 1階差分
dty1<-diff(ty1)
par(mfrow=c(3,1))
plot(dty1)
acf(dty1,lag.max=60)
pacf(dty1,lag.max=60)
par(mfrow=c(1,1))
sarima01<-arima(ty1,order=c(2,1,2),seasonal=list(order=c(1,1,1),period=12))
par(mfrow=c(2,1))
tres<-sarima01$resid
ty1_hat<-ty1-tres
plot(ty1)
lines(ty1_hat,lty=2,col=2)
plot(tres,type="l",col=4)
abline(h=mean(tres))
par(mfrow=c(1,1))
pred1<-predict(sarima01,n.ahead=12)
xt<-c(2005,2009)
y1es<-pred1$pred
sig1<-pred1$se
tyl<-y1es-2*sig1
tyu<-y1es+2*sig1
yl<-c(min(ty1,tyl),max(ty1,tyu))
plot(ty1,xlim=xt,ylim=yl)
lines(y1es)
lines(tyl,lty=2,col=4)
lines(tyu,lty=2,col=4)
pred1<-predict(sarima01,n.ahead=24)
xt<-c(1978,2009)
y1es<-pred1$pred
sig1<-pred1$se
tyl<-y1es-2*sig1
tyu<-y1es+2*sig1
yl<-c(min(ty1,tyl),max(ty1,tyu))
plot(ty1,xlim=xt,ylim=yl)
lines(y1es)
lines(tyl,lty=2,col=4)
lines(tyu,lty=2,col=4)
Posted by ryu908 at
16:31
│Comments(0)
2008年07月12日
rpartの解析例
Rコマンダーを使用して、視覚的なプレゼンに使えそうなものを色々試す。
散布図行列で変数間の全体的な関連を把握する。

x1:地域差指数総合
x2:地域差指数食料
x3:一人当たり県民所得
x4:県内総生産額対前年増加率
x5:県内総生産対前年増加
x6:財政力指数
x7:携帯電話
x8:パソコン所有数量
x9:第1次産業就業者比率
x10:保育所数
x11:労働災害発生の頻度
そのうち2変数をピックアップして、「x4:県内総生産額対前年増加率」の回帰曲面と立体的関係を見てみる。

regt<-rpart(x4~x1+x2+x3+x6+x7+x8+x9+x10+x11,data=region)
regt
n= 47
node), split, n, deviance, yval
* denotes terminal node
1) root 47 65.646380 0.4829787
2) x3< 2949.5 36 37.122220 0.1777778
4) x2< 99.65 12 7.629167 -0.4583333 *
5) x2>=99.65 24 22.209580 0.4958333
10) x11>=1.495 17 9.102353 0.2470588 *
11) x11< 1.495 7 9.500000 1.1000000 *
3) x3>=2949.5 11 14.196360 1.4818180 *

変数x4(県内総生産額対前年増加率)47都道府県が
変数x3(一人当たり県民所得)の2950千円を境に36と11に分類される。
11都道府県はx3が2950千円より大きく、増加率の平均が1.482と高いグループである。
36都道府県のグループはさらに変数x2(地域差指数食料)で12と24の集団に分けられ、x2が99.65より小さい12都道府県群の増加率の平均が-0.4583の集団である。
残りは、さらに変数x11(労働災害発生の頻度)で17と7の集団に枝分かれし、x11が1.495より大きい都道府県が増加率の平均が0.2471の群。
それより大きい都道府県が増加率の平均が1.1の群である。
このデータセットから言えることは、経済成長の指標として採用したx4の要因としてピックアップした全11変数のうち、x3、x2、x11の3変数で説明でき、最初にx3で大きく分類することができるということが分かる。また、地域差指数食料の小さいほうが経済成長が低いグループとなっている。
+++++++++++++++++++++++++++++++++++++++++++++++
+++++++++++++++++++++++++++++++++++++++++++++++
regt<-rpart(x6~x1+x2+x3+x4+x7+x8+x9+x10+x11,data=region)
n= 47
node), split, n, deviance, yval
* denotes terminal node
1) root 47 1.57249000 0.4280851
2) x1< 104.55 40 0.42904700 0.3702250
4) x3< 2527.5 15 0.01864960 0.2714000 *
5) x3>=2527.5 25 0.17600420 0.4295200
10) x10>=445.85 8 0.01027288 0.3548750 *
11) x10< 445.85 17 0.10017990 0.4646471 *
3) x1>=104.55 7 0.24432140 0.7587143 *

x6:財政力指数について要因分析を描画した。
財政力指数はx1(地域差指数総合)で基本的な分類ができ、104.55より大きい7都道府県が高い財政力をもつと判断される。
それ以外の40都道府県は、x3(一人当たり県民所得)が2528千円より低い15都道府県と、大きい25都道府県に分類される。
この25都道府県はさらにx10(保育所数)が445.8より多い17都道府県と、そうでない8都道府県に分けられる。そのうち財政力の高いのは保育所の少ないほうである。
ここでは経済成長と財政健全度という2つの例をあげたが、分類するためにモデルに組み込まれた変数と、分類の結果に関しては、何故このような分類になったか、色々な仮説なり、想像をめぐらすことができる。特に、財政力指数と保育所の関係は興味深いが、なぜこうなったかは、他の情報を利用したりするなどして、もっと考えてみる必要がありそうだ。
散布図行列で変数間の全体的な関連を把握する。

x1:地域差指数総合
x2:地域差指数食料
x3:一人当たり県民所得
x4:県内総生産額対前年増加率
x5:県内総生産対前年増加
x6:財政力指数
x7:携帯電話
x8:パソコン所有数量
x9:第1次産業就業者比率
x10:保育所数
x11:労働災害発生の頻度
そのうち2変数をピックアップして、「x4:県内総生産額対前年増加率」の回帰曲面と立体的関係を見てみる。

regt<-rpart(x4~x1+x2+x3+x6+x7+x8+x9+x10+x11,data=region)
regt
n= 47
node), split, n, deviance, yval
* denotes terminal node
1) root 47 65.646380 0.4829787
2) x3< 2949.5 36 37.122220 0.1777778
4) x2< 99.65 12 7.629167 -0.4583333 *
5) x2>=99.65 24 22.209580 0.4958333
10) x11>=1.495 17 9.102353 0.2470588 *
11) x11< 1.495 7 9.500000 1.1000000 *
3) x3>=2949.5 11 14.196360 1.4818180 *

変数x4(県内総生産額対前年増加率)47都道府県が
変数x3(一人当たり県民所得)の2950千円を境に36と11に分類される。
11都道府県はx3が2950千円より大きく、増加率の平均が1.482と高いグループである。
36都道府県のグループはさらに変数x2(地域差指数食料)で12と24の集団に分けられ、x2が99.65より小さい12都道府県群の増加率の平均が-0.4583の集団である。
残りは、さらに変数x11(労働災害発生の頻度)で17と7の集団に枝分かれし、x11が1.495より大きい都道府県が増加率の平均が0.2471の群。
それより大きい都道府県が増加率の平均が1.1の群である。
このデータセットから言えることは、経済成長の指標として採用したx4の要因としてピックアップした全11変数のうち、x3、x2、x11の3変数で説明でき、最初にx3で大きく分類することができるということが分かる。また、地域差指数食料の小さいほうが経済成長が低いグループとなっている。
+++++++++++++++++++++++++++++++++++++++++++++++
+++++++++++++++++++++++++++++++++++++++++++++++
regt<-rpart(x6~x1+x2+x3+x4+x7+x8+x9+x10+x11,data=region)
n= 47
node), split, n, deviance, yval
* denotes terminal node
1) root 47 1.57249000 0.4280851
2) x1< 104.55 40 0.42904700 0.3702250
4) x3< 2527.5 15 0.01864960 0.2714000 *
5) x3>=2527.5 25 0.17600420 0.4295200
10) x10>=445.85 8 0.01027288 0.3548750 *
11) x10< 445.85 17 0.10017990 0.4646471 *
3) x1>=104.55 7 0.24432140 0.7587143 *

x6:財政力指数について要因分析を描画した。
財政力指数はx1(地域差指数総合)で基本的な分類ができ、104.55より大きい7都道府県が高い財政力をもつと判断される。
それ以外の40都道府県は、x3(一人当たり県民所得)が2528千円より低い15都道府県と、大きい25都道府県に分類される。
この25都道府県はさらにx10(保育所数)が445.8より多い17都道府県と、そうでない8都道府県に分けられる。そのうち財政力の高いのは保育所の少ないほうである。
ここでは経済成長と財政健全度という2つの例をあげたが、分類するためにモデルに組み込まれた変数と、分類の結果に関しては、何故このような分類になったか、色々な仮説なり、想像をめぐらすことができる。特に、財政力指数と保育所の関係は興味深いが、なぜこうなったかは、他の情報を利用したりするなどして、もっと考えてみる必要がありそうだ。
Posted by ryu908 at
19:09
│Comments(0)
2008年07月09日
2008年7月9日
smple_data
region<-read.table("clipboard",header=T)
library(relimp)
showData(region)
library(Rcmdr)
regt<-rpart(x4~x1+x2+x3+x6+x7+x8+x9+x10+x11,data=region)
regt
plot(regt,margin=0.1)
text(regt,use.n=T)
region<-read.table("clipboard",header=T)
library(relimp)
showData(region)
library(Rcmdr)
regt<-rpart(x4~x1+x2+x3+x6+x7+x8+x9+x10+x11,data=region)
regt
plot(regt,margin=0.1)
text(regt,use.n=T)
Posted by ryu908 at
16:08
│Comments(0)
2008年07月07日
R(MASS)package data(biopsy)
ここはRのMASS packageに含まれるデータでで、以下のように参照する。
library(MASS)
help(biopsy)
大文字なのでWin派は入力ミスに注意。
biopsy(MASS) R Documentation
Biopsy Data on Breast Cancer Patients
Description
This breast cancer database was obtained from the University of Wisconsin Hospitals, Madison from Dr. William H. Wolberg. He assessed biopsies of breast tumours for 699 patients up to 15 July 1992; each of nine attributes has been scored on a scale of 1 to 10, and the outcome is also known. There are 699 rows and 11 columns.
Usage
biopsy
Format
This data frame contains the following columns:
ID Sample code number (not unique)
V1 Clump thickness
V2 Uniformity of cell size
V3 Uniformity of cell shape
V4 Marginal adhesion
V5 Single epithelial cell size
V6 Bare nuclei (16 values are missing)
V7 Bland chromatin
V8 Normal nucleoli
V9 Mitoses
class
"benign" or "malignant"
Source
P. M. Murphy and D. W. Aha (1992). UCI Repository of machine learning databases. [Machine-readable data repository]. Irvine, CA: University of California, Department of Information and Computer Science.
O. L. Mangasarian and W. H. Wolberg (1990) Cancer diagnosis via linear programming. SIAM News 23, pp 1 & 18.
William H. Wolberg and O.L. Mangasarian (1990) Multisurface method of pattern separation for medical diagnosis applied to breast cytology. Proceedings of the National Academy of Sciences, U.S.A. 87, pp. 9193–9196.
O. L. Mangasarian, R. Setiono and W.H. Wolberg (1990) Pattern recognition via linear programming: Theory and application to medical diagnosis. In Large-scale Numerical Optimization eds Thomas F. Coleman and Yuying Li, SIAM Publications, Philadelphia, pp 22–30.
K. P. Bennett and O. L. Mangasarian (1992) Robust linear programming discrimination of two linearly inseparable sets. Optimization Methods and Software 1, pp. 23–34 (Gordon & Breach Science Publishers).
References
Venables, W. N. and Ripley, B. D. (1999) Modern Applied Statistics with S-PLUS. Third Edition. Springer.
Posted by ryu908 at
07:02
│Comments(0)
2008年06月09日
時系列データの解析と予測
経済学で扱うデータは基本的に2つに分けられる。
①.時系列データ(Time series data)
②.横断面データ(Cross section data)
クロスセクションは国別のデータとか個人別データ、店舗別データなどの時間と関係のないものであったが、時系列データとは年度別、月別、曜日別といった特定の指標の時間推移を示すものである。
なお両方同時に扱うものとしてプーリングデータ(パネルとか最近は言う)がある。
時系列(Wikipedia)
データの読み込み
read.table関数によるファイルの読み込み
read.table("ファイル名")
read.table("ファイル名",header=T)
(データの1行目に変数名がある場合「header=T」をつける)
まずExcelを起動する。
このデータをクリックして起動
Posted by ryu908 at
08:59
│Comments(0)
2008年05月26日
2005年5月26日 R code
sample data file
### 回帰木の生成と分類ルールの作成
x <- iris
library(mvpart)
result <- rpart(Species ~ ., data=x, control=rpart.control(cp=.01))
plot.new() # デバイスを開く
par(xpd=T) # 文字が切れないための命令
plot(result, uniform=T, branch=0.7, margin=0.05)
text(result, use.n=T, all.leaves=F)
### テキストで分類ルールを見る
summary(result)
### 木の枝数を指定する
result <- rpart(Species ~ ., data=x,
control=rpart.control(nsplit=12, cp=.001, minsplit=1))
plot(result, uniform=T, branch=0.7, margin=0.1)
text(result, use.n=T, all.leaves=F)
### 最適な葉の数を調べる
plotcp(result)
result <- rpart(Species ~ ., data=x,
control=rpart.control(cp=.1))
plotcp(result)
plot.new() # すでにデバイスウィンドウ(グラフ)が開いているときは不要
par(xpd=T) # 文字が切れないための命令
plot(result, uniform=T, branch=0.7, margin=0.05)
text(result, use.n=T, all.leaves=F)
### 分類ルール:カテゴリデータの中身の確認
y <- data.frame(STATUS=c(rep("既婚",84),rep("未婚",116)),
GROUP =c(rep("購入",73),rep("購入しない",127)),
SEX =c(rep(2, 2),rep(1,72),rep(2, 6),
rep(1, 4),rep(2,92),rep(1,24)))
y$SEX <- factor(y$SEX)
levels(y$STATUS) # 結果の左から順に a, b, c, ... となる
# a が "既婚",b が "未婚"
### 回帰木による判別
set.seed(77777)
tmp <- sample(1:150, 100)
x <- iris[ tmp,] # 分類ルール作成用データ 100 個
y <- iris[-tmp,] # 予測をおこなうためのデータ 50 個
table(x$Species) # x の内訳
result <- rpart(Species~., data=x)
result2 <- predict(result, y, type="class")
table(y$Species, result2)
### 各データの分類結果
result <- rpart(Species~., data=x)
result2 <- predict(result, y, type="class")
result2
Posted by ryu908 at
11:27
│Comments(5)
2008年05月21日
2008年05月12日
課題
Call:
lm(formula = y ~ log(x))
Residuals:
Min 1Q Median 3Q Max
-8.3156 -6.2022 -3.5966 0.9103 87.4276
Coefficients:
Estimate Std. Error t value Pr(>|t|)
(Intercept) 6.693 1.686 3.971 0.000137 ***
log(x) 14.152 2.006 7.056 2.56e-10 ***
---
Signif. codes: 0 '***' 0.001 '**' 0.01 '*' 0.05 '.' 0.1 ' ' 1
Residual standard error: 12.81 on 97 degrees of freedom
(1 observation deleted due to missingness)
Multiple R-Squared: 0.3392, Adjusted R-squared: 0.3324
F-statistic: 49.78 on 1 and 97 DF, p-value: 2.562e-10


Posted by ryu908 at
13:40
│Comments(0)


